

Using Workspot Trends
Updated: April 8, 2024
Workspot Trends provides enables you organization to make data-driven decisions that optimize the performance of your Workspot deployment worldwide. Workspot Trends shows your users’ Workspot experience over time with user experience surveys, network performance, and system performance.
User-reported satisfaction is a flexible way of identifying which parts of your Workspot deployment are working best and which may need attention.
Release Status
- Release 1.7.0 is in production.
- Trends is a standard feature, available to all Workspot customers.
- New features and bug fixes are expected to occur frequently.
Release 1.7.0
- A new “Sizing” tab shows reports on desktops suspected on being undersized or oversized for their workload. This is determined by memory and CPU load. See Desktop Sizing, below.
- Support for multiple Trends instances, initially https://trends.us.workspot.com and https://trends.eu.workspot.com, for data sovereignty.
- Bug fixes and usability improvements.
Release 1.6.1.1
- Improved uptime accounting for desktops that become deleted.
Release 1.6
- Trends now reports information about the Client's network adapter and IP settings.
Release 1.5
- The Cloud Apps usage dashboard now has tabs for Cloud Apps and User Activity in addition to Cloud App Pools and Cloud App Servers.
- A report of per-user desktop usage has been added to the Cloud desktop usage dashboard.
- The User Experience dashboard now shows all pools, desktops, and users, not just ones with user ratings.
- Bug fixes.
Release 1.4
Highlights:
- A new "Usage > Cloud Apps" tab summarizes usage of published applications (RD pool apps).
- You can now enable daily email notifications giving the total number of 1-2 star user feedback ratings. The settings are reached through the three-vertical-dot "kebab menu" at the upper-right-hand corner of the screen.
- Disk I/O performance is now shown in the same per-user graphs as CPU performance.
Fixed Bug:
- A bug that caused Trends to report excessive numbers of user session hours has been fixed.
Known Issue:
- Trends doesn't work if third-party cookies are blocked in the browser, as they are by default in Google Chrome's Incognito Mode. Workaround: Use a browser (or browser mode) that allows third-party cookies.
Release 1.3
- A “Usage” tab was added to the top-level navigation to give functionality similar to the “Reports” tab in Workspot Control, which will be phased out soon.
Introduction
Trends helps you understand:
- Are my users happy?
- How is user experience satisfaction trending across groups/pools/users?
- How many users are more satisfied vs. less satisfied?
- Compare performance between one or more users/pools.
- Understand user participation across pools.
- View detailed feedback provided by users.
- Examine potential sources of dissatisfaction or low performance.
Video Demo
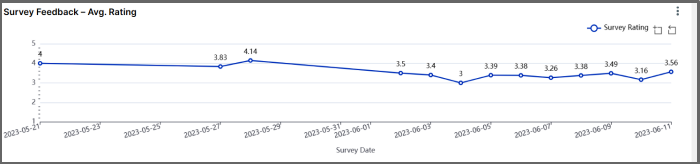
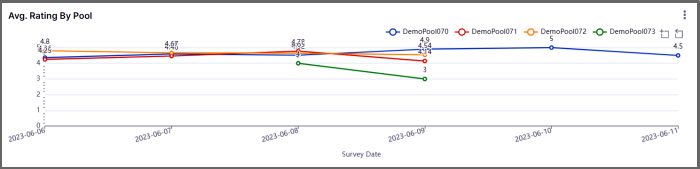
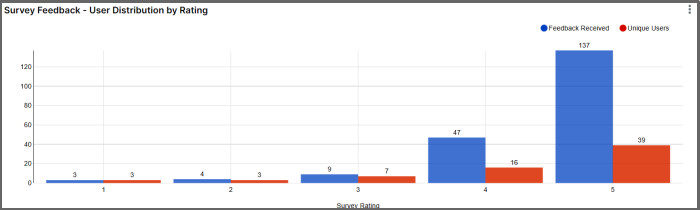
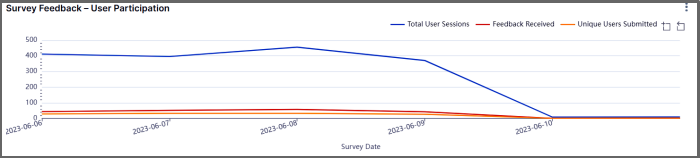
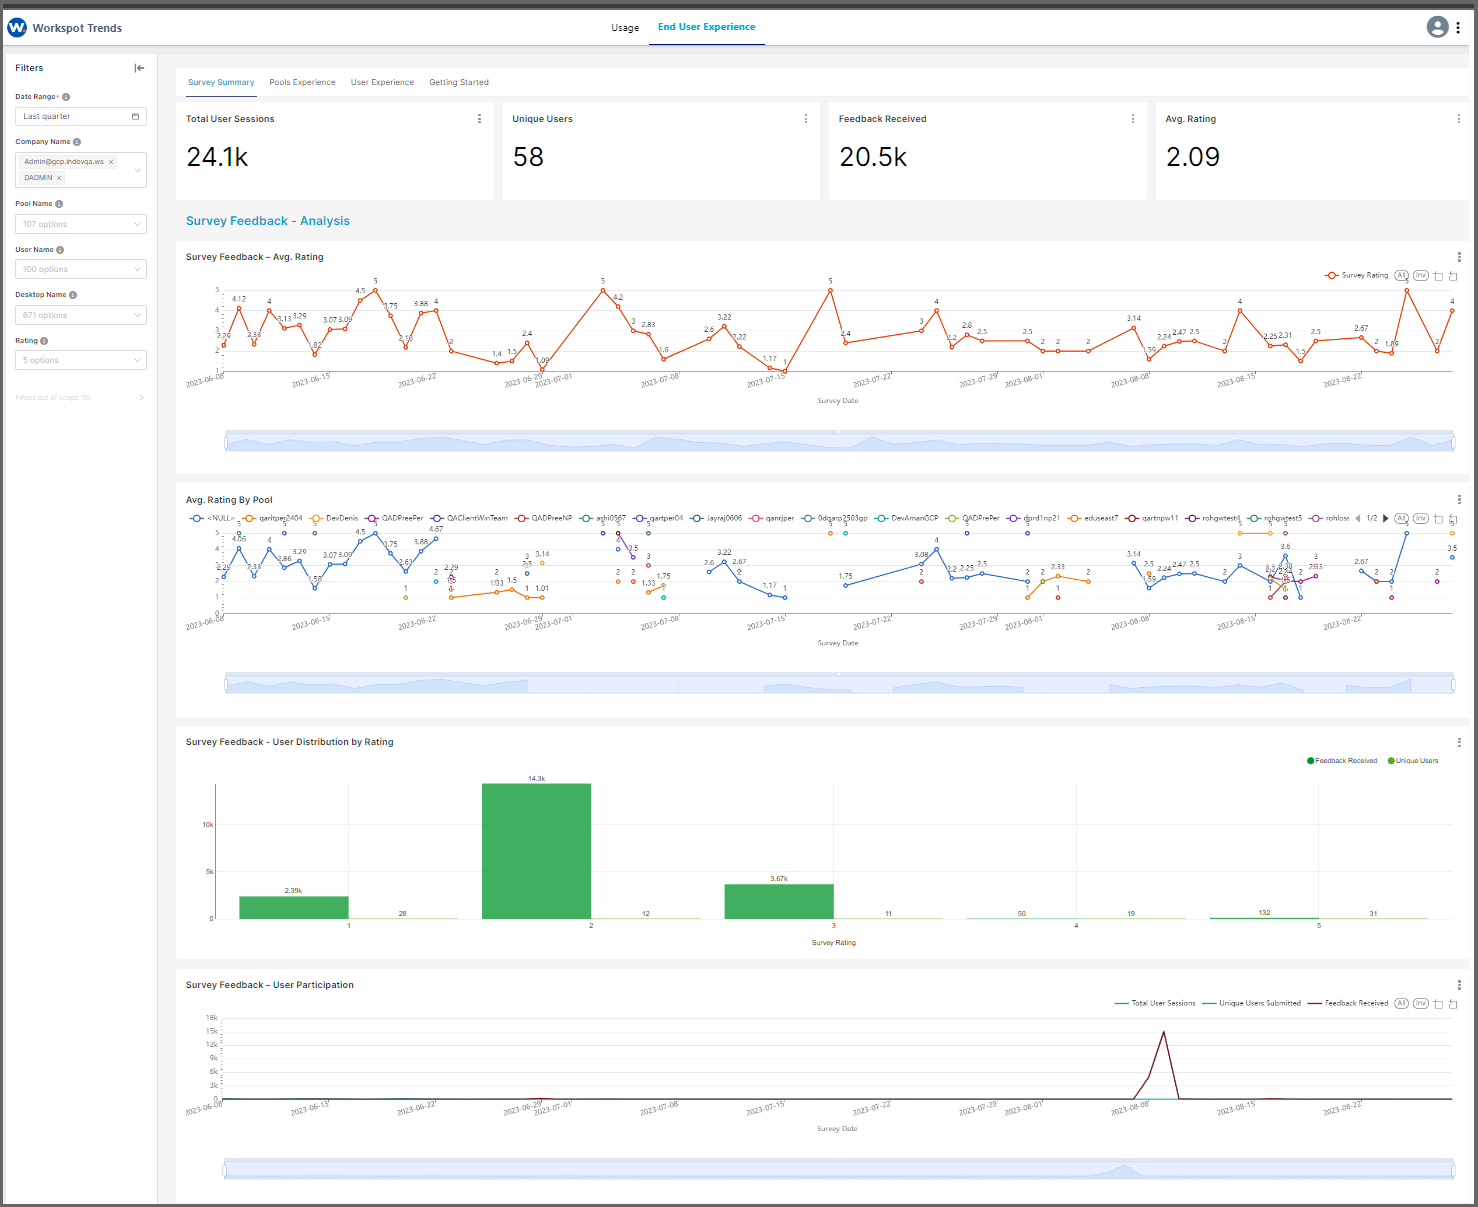
Example Workspot Trends Graphs
Overall user survey rating over time
Per-pool user survey rating over time
Survey result histogram by rating
User participation in survey over time
Signing into Workspot Trends
- Ensure that Trends permissions are granted to your Workspot account. Follow the procedure in Administrating Workspot Watch in Control (Watch and Trends use the same permissions page).
- Sign-in option 1: Sign into Trends from Control via the “Reports > Workspot Trends > Open” button.
- Sign-in option 2: Sign into Trends from https://trends.us workspot.com/companyIdentifier or https://trends.eu workspot.com/companyIdentifier, where
- companyIdentifier is specific to your company, as listed in Workspot Control under “Setup > Configuration > Access > Subdomain.”
- US or EU are the location of your Workstation deployment. (Most current deployments are in the US region.)
- Once signed in, you will see the Trends dashboard, which defaults to the Survey Summary page for the past week.
Top-Level Navigation
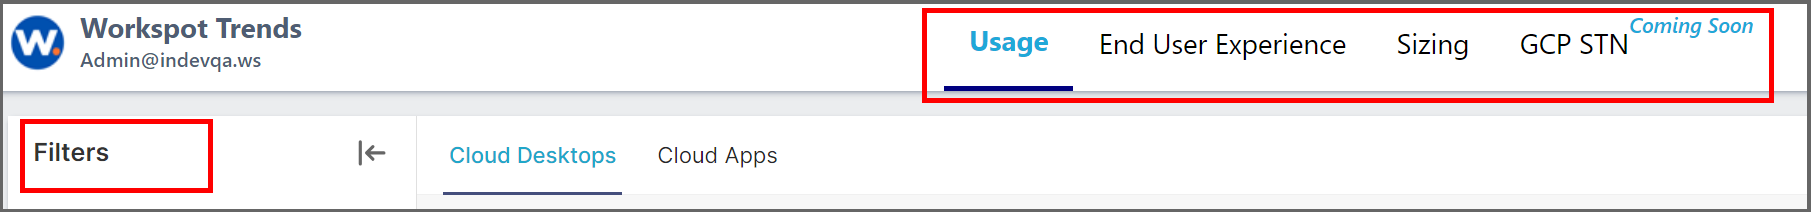
The top-level navigation strip has four tabs. In addition, there is a “Filters” sidebar with contents that change somewhat according to which tab you’re on.
- Usage
- User Experience
- The “Sizing” Tab
- GCP STN (Coming Soon)
These are described below.
The User Experience Tab
Trends’ “User Experience” tab is subdivided into four major tabs and a filter sidebar.
Tabs
The major tabs are:
- Survey Summary, the default landing page.
- Pools Experience, which shows data on a per-pool basis:
- Survey feedback summary.
- CPU utilization per pool.
- Number of desktops with CPU utilization over 80%.
- Memory utilization per pool.
- Number of desktops with memory utilization over 80%
- Average TCP RTT and UDP bandwidth.
- Average disk throughput in I/O operations and megabytes per second.
- User Experience, which shows data on a per-user basis.
- User list, which shows feedback statistics and the number of sessions.
- User rating over time.
- CPU, TCP, and disk utilization as with the Pools Experience tab, but expressed per-user instead of per-pool.
- Getting Started, which gives introductory information.
Filter Sidebar
The filter sidebar is on the left side of the screen and is initially closed. Its scope changes somewhat depending on which tab is active, with the Survey Summary tab having the complete set of filters. These are:
- Date range. Defaults to the past week.
- Company name (restricted to your company, of course).
- Pool name. Defaults to all pools.
- User name. Defaults to all users.
- Desktop name. Defaults to all desktops.
- Rating. Defaults to all ratings.
Using a filter can declutter the graphs and tables and increase responsiveness.
When setting a filter, you can select more than one entry per category. The example below shows that three users have been selected:
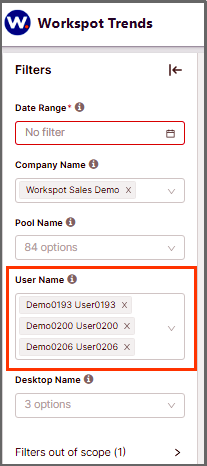
Filter Notes
- Investigating small groups of users works best when no more than five users are selected.
- When you navigate to a tab that doesn’t use a given filter, your selection is remembered when you return to a tab where it is available.
- Filters are not applied until you press the (easily overlooked) “Apply Filters” button at the bottom of the page.
The “Usage” Tab
“Usage” gives several simple reports. It is divided into two major sub-tabs: “Cloud Desktops” and “User Activity.”
Cloud Desktops Sub-Tab
The “Cloud Desktops” is laid out similarly to the “End User Experience” tab, but with per-user and per-pool usage statistics.
- Summary statistics: Total active users, Total user sessions, Total usage hours, Daily average use per user.
- Time series: Active users per day and Overall usage per day (in session-hours).
The filters work as with the “End User Experience” tab.
Cloud Apps Sub-Tab
“Cloud Apps” gives the same insight as “Cloud Desktops,” but about Applications and App Servers rather than desktops and desktop pools.
User Activity Sub-Tab
The “User Activity” tab has two tables: one giving usage information per user and the other listing “inactive users” who haven’t signed in in at least 90 days. Such users may need assistance in using Workspot or, if they no longer need a Workspot desktop, removing their Workspot accounts from Control may be called for.
The “Sizing” Tab

The “Sizing” tab reveals desktops that may be undersized oversized for their usage, which can indicate problems with the programs running on the VM or that the user needs to be migrated a different VM size.
- An undersized desktop has consistently high CPU or memory usage. The user may benefit from being migrated to a more capable VM.
- An oversized desktop has consistently low CPU and memory usage. Migrating the user to a lower-cost VM may be possible without a noticeable reduction in performance.
Samples are taken periodically across the sampling window to evaluate four thresholds:
- High CPU Threshold: detects undersized VMs. If at least 80% of the CPU usage samples (in percentage of CPU load) are above the user-selected threshold, the desktop is undersized.
- Low CPU Threshold: detects oversized VMs. If at least 80% of the CPU usage samples (in percentage of CPU load) are below the user-selected threshold, the desktop is oversized.
- High Memory Threshold: detects undersized VMs. If at least 80% of the memory usage samples (in percentage of memory in use) are above the user-selected threshold, the desktop is undersized.
- Low Memory Threshold: detects oversized VMs. If at least 80% of the memory usage samples (in percentage of memory in use) are below the user-selected threshold, the desktop is oversized.
The CPU and Memory Thresholds are set in the filter sidebar.