

Using Workspot Watch
by Robert Plamondon
Last updated on May 2, 2024
Workspot Watch allows you to monitor your entire Workspot installation across all configured Clouds, Pools, Workspot Watch provides end-to-end telemetry of all Workspot components across your global deployment. This includes Cloud, desktop pools, app servers, gateways, end-user sessions, and the status of individual Workspot desktops.
This document is an introduction to using Workspot Watch
Contents
Workspot Watch Demo Video
Current and Upcoming Releases
Watch 5.1.0
- A “Feedback” button has been added to the top of the Watch UI so Watch users can send ratings and suggestions to Workspot.
- Alerts about VMs not entering or leaving a power-saving state are now inhibited when power management is disabled at the pool level.
- The “Patch Available” Gateway VM status field now says “NA” when only unsupported patches are available.
Watch 5.0.1
- Watch no longer includes Microsoft Security Patches that are known to be inapplicable to many VMs in its “Patch Age” calculations. An example includes KB5034439, which applies only to VMs with recovery partitions.
Watch 5.0.0
- Configurable email notifications for different kinds of alarms.
- Workspot Gateway and Workspot Enterprise Connector alarms have been added to the Alarms page.
Signing into Workspot Watch
- Ensure that Watch permissions are granted to your Workspot account. Follow the procedure in Administrating Workspot Watch in Control.
- Sign into Watch from https://watch.workspot.com/CompanyIdentifier, where Company Identifier is specific to your company, as listed in Workspot Control under “Setup > Configuration > Access > Company Identifier.”
- Once signed in, you will see the Watch dashboard, which defaults to the Alarms page.
Watch Pages
Watch is divided into six pages:
- Alarms. Shows the most recent alarm events. Active alarms are shown in red or yellow. Once resolved, the alarm is shown in green. Click on the relevant field to discover more.
- Map. A world map showing your Cloud datacenters and your choice of several set of information about them.
- Pools. Status of desktop pools and app server pools.
- Desktop. Status of a single desktop.
- Infrastructure. Status of Workspot gateways, Workspot Connectors, and application servers.
- Trace. Similar to Alarms, but includes routine (non-alarm) messages as well.
Alarms Page
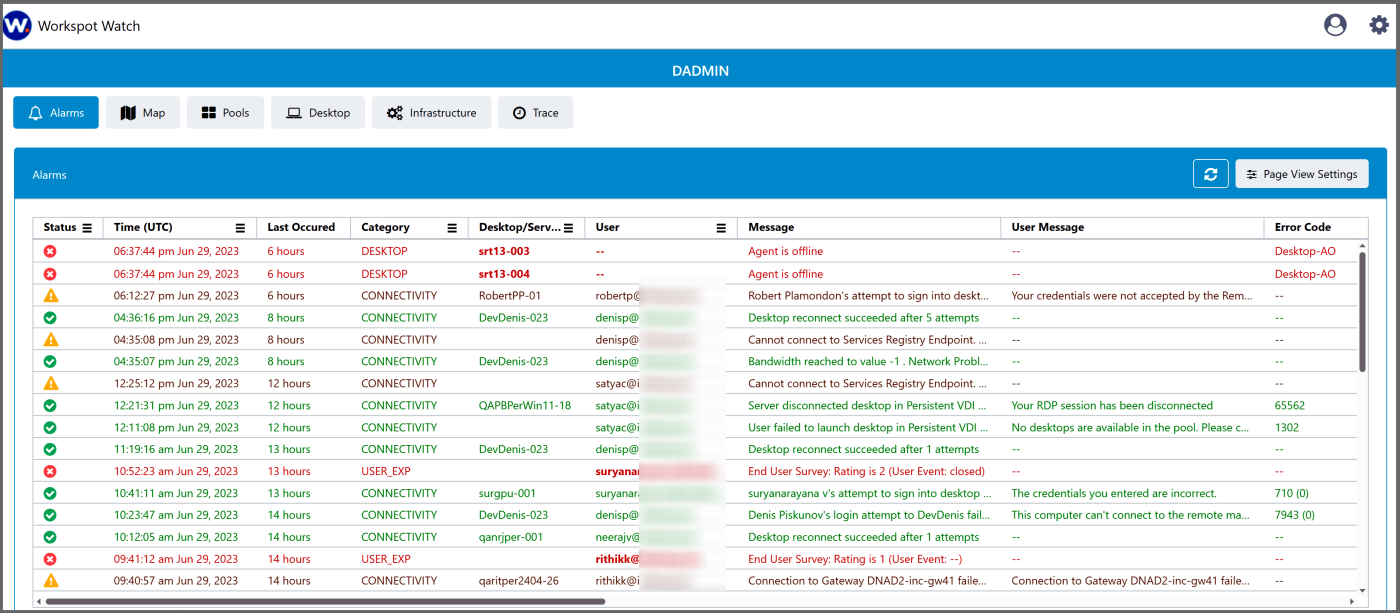
The Alarms page is Watch’s default landing page. It displays trouble items that you may wish to be aware of.
Its entries are always sorted newest-first. Clicking the “hamburger” icon at the top of each column lets you filter the page by the selected values.
The Alarms page contains more columns than can ordinarily be displayed. You can scroll the page horizontally and drag and drop columns of interest to the left.
As with the Alarms page, the Desktop/Server and User columns serve as links to detailed information.
Most features on this page are self-explanatory. Important columns include:
- Status. The alert level, which is one of Critical, Warn, or Success, colored red, amber, or green, respectively. A green item is one that started out red or amber but has since been resolved.
- Category. The general category of the Alarm.
- Desktop/Server. The individual desktop or app server involved in the Alarm, if any. Clicking the Desktop/Server name takes you to a detailed status page so you can investigate further.
- User. The email address of the user associated with the Alarm. Clicking this email address takes you to a user status page that lists all recent Event messages for that user.
- Message and User Message. The Message field shows the text that was logged as a Control event. The User Message shows what was shown to the Client user.
- Region. The location of the Workspot Cloud resource such as a Workspot desktop or app server. This uses the Cloud provider’s name for the region containing the Cloud datacenter.
- Location. The location of the Workspot Client user, if any. The granularity may be at the city level or the state level, depending on location. This generally uses IP-based geolocation and may not be reliable if proxies or VPNs are used.
- Pool. The desktop pool or app server pool involved in the Alarm.
- Gateway/VPN. Workspot connections usually have three major components: the Client, the Workspot desktop/app, and the gateway or VPN. The gateway is identified in case it is participating in the problem.
- Client Version and Device OS & Version. These show the release number of the Workspot Client and the OS the Client is running on, respectively.
- Network. This is the SSID of the network the Client is running on, if known.
Map Page
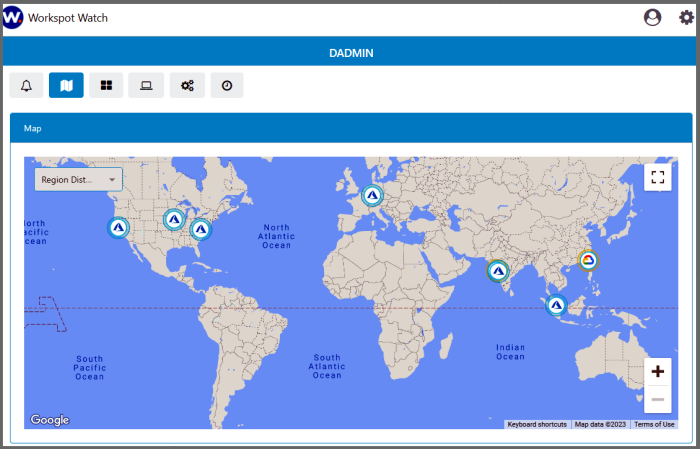
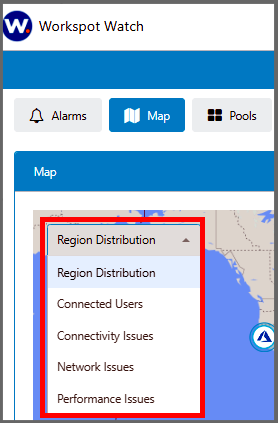
The map pages shows a world map. By default, all your datacenters are displayed (the “Region Distribution” option). The full list of options is:
- Region Distribution. Shows the location of all your datacenters and which Cloud they are associated with. A mouseover on the datacenter shows its region name and the number of desktops it contains.
- Connected Users. Shows the location of all connected Client users.
- Connectivity Issues. A large red circle with a number shows the number of connectivity-related alarms for a given datacenter. A small red circles shows the location of the associated end-user.
- Network Issues. Shows the location of end-users who experienced network issues.
- Performance Issues. Shows the location of performance issues.
Note: A wide display will show duplicate continents, but the datacenters will be shown on only one of them.
Note: If you scroll the map horizontally, datacenters will vanish long before they reach the end of the display.
Pools Page
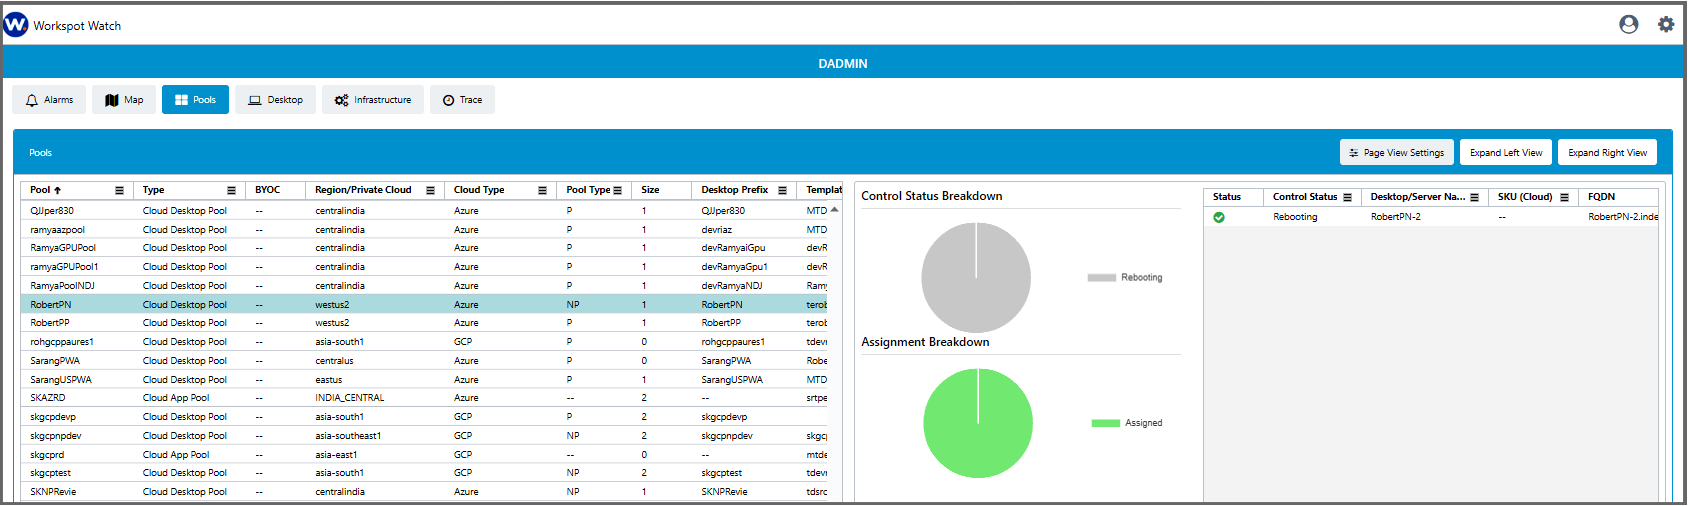
The pools page lists all the defined desktop pools and application server pools, one line per pool.
Clicking anywhere on a line displays a pool detail page in the right-hand pane. In the pool details table, the “Desktop/Server Name” and “Assign User Name” entries are clickable. These take you to the Desktop page or the Trace page, respectively.
The pool list can be sorted by any column by clicking on the column header. In addition, you can filter on the contents of a column by clicking the “hamburger” icon at the top of the column.
Use the “Expand Left View” and “Expand Right View” to give the entire window to the desired pane.
The pool list and pool details panes have too many columns to list here. Use the horizontal scroll bar to see all the available columns. You can drag columns to the desired location.
Resource Page
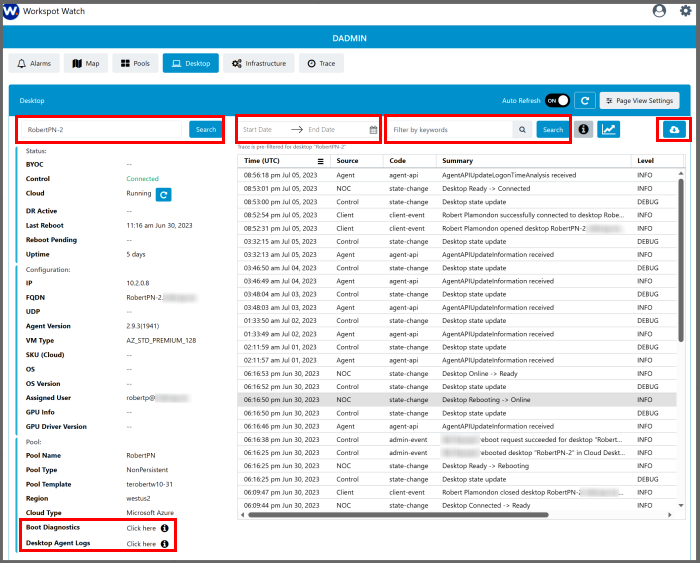
The Desktop page shows the status of a single desktop, selected through the left-hand Search box or by navigating to this page by clicking on a desktop on the Alarms or Pools page.
The page has a status/configuration pane on the left and an Events page on the right.
Status Pane
The status/configuration pane gives details about the desktop VM status, including its running state, uptime, IP address, OS type, assigned user, pool name, Cloud provider and region, and so on.
Events pane
The Events pane gives the most recently logged events, newest first. The columns cannot be sorted by you can filter the events through the “Filter by Keywords” box and select a new date range through the “Start Date” and “End Date” boxes at the top of the pane.
The Cloud button downloads the events to a .csv file.
Infrastructure Page
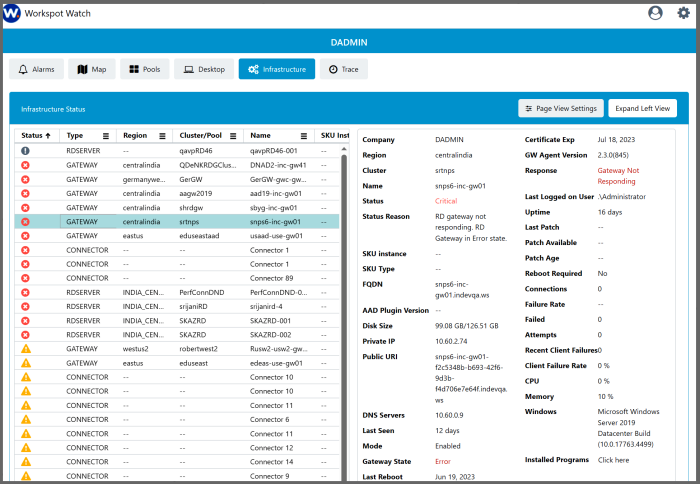
The infrastructure page lists infrastructure objects that have been the subject of an Alarm recently. An infrastructure object is one of the following:
- CONNECTOR. The Workspot Enterprise Connector service running on one of your VMs.
- GATEWAY. A Workspot Managed RD Gateway.
- RDSERVER. A Microsoft Server VM used as an application server.
Status Pane and Detail Pane
By default, these are listed in order of Status. Clicking the “Status” column cycles the status through worst-first, best-first, and sorting by object type.
The right-hand pane gives the status of the selected infrastructure object. The “Expand Left View/Split View” button toggles between the split-pane and single-pane views.
The Status Pane has too many columns to list here. Use the horizontal scroll bar to see all the available columns. You can drag columns to the desired location.
Trace Page
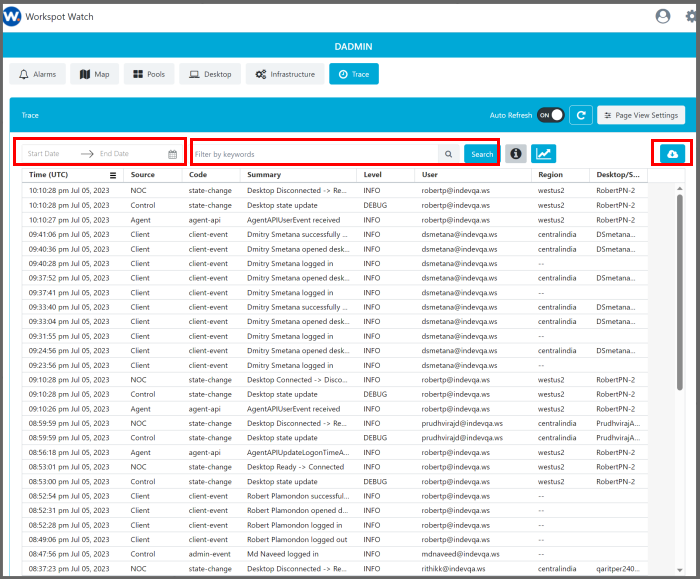
By default, the Trace page lists all the logged Events, newest-first. It can also show a velocity graph of the most recent events that match a specific keyword.
Events Table
- You can choose a custom date range using the “Start Date” and “End Date” boxes.
- You can filter by keywords in the “Search” box.
- You can also download a .csv file of the Events with the Cloud button.
- Clicking on an entry in the “Desktop/Server” column takes you to the “Desktop” page for that desktop or server.
The Events Table has the following columns: Time, Source, Code, Summary, Level, User, Region, and Desktop/Server. The contents of all these columns except Time can be used to filter results by keyword.
To use the filter-by-keyword function, type a keyword (or partial keyword) from into the Search box and clidk the “Search” button. Searches are not case-sensitive. Useful keywords include:
- Event level: DEBUG, INFO, or ERROR.
- Event source: Agent, Client, Control, NOC (an obsolete term for Watch), PRS (power management), etc.
- Username or partial username.
- Region name.
- Desktop name.
- Any relevant string from the Summary column.
Note: If the search function becomes unresponsive, refresh the page.
Velocity Graph
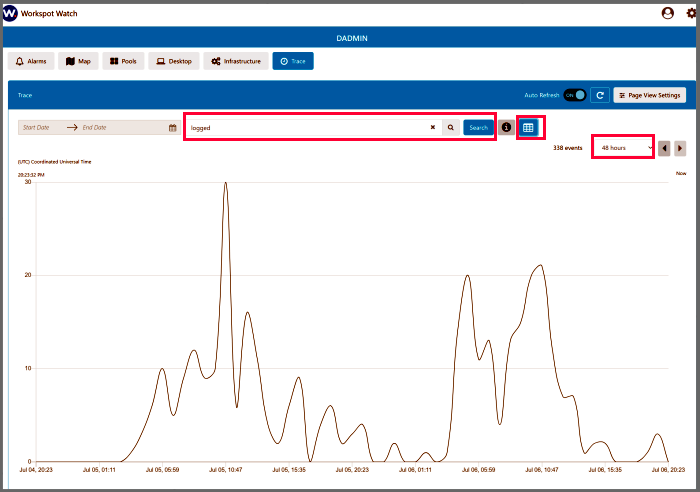
Clicking the Graph/Table button to the right of the Search box shows the Velocity Chart, which shows the number of filtered Events per unit time.
Note: Unlike the Events table, which shows everything by default, the Velocity Chart shows nothing by default, and no way of showing everything is provided.
To use the Velocity Graph:
- Click the “Graph/Table” button until the (unlabeled) velocity graph is shown.
- Enter a filter string (as described above) in the Search box and press “Search.”
- Optional: Select a timeframe. The “Start Date/End Date” boxes are grayed out, but there is a timeframe pull-down menu at the right side of the screen. Select a timeframe between 30 minutes (the default) and 48 hours.
- Optional: Use the “Forward/Back” arrows next to the Timeframe pulldown to navigate forward and backward in time.
Email Notifications
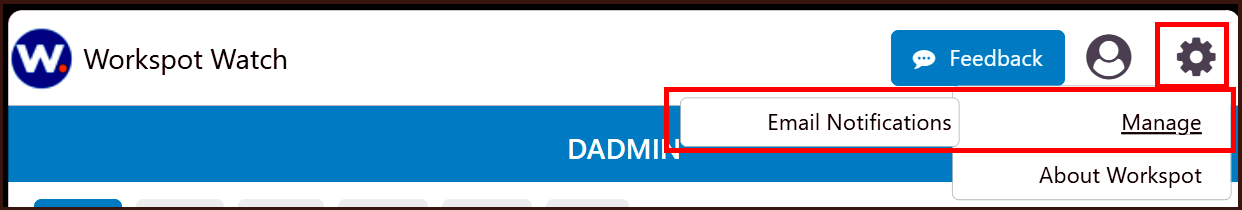
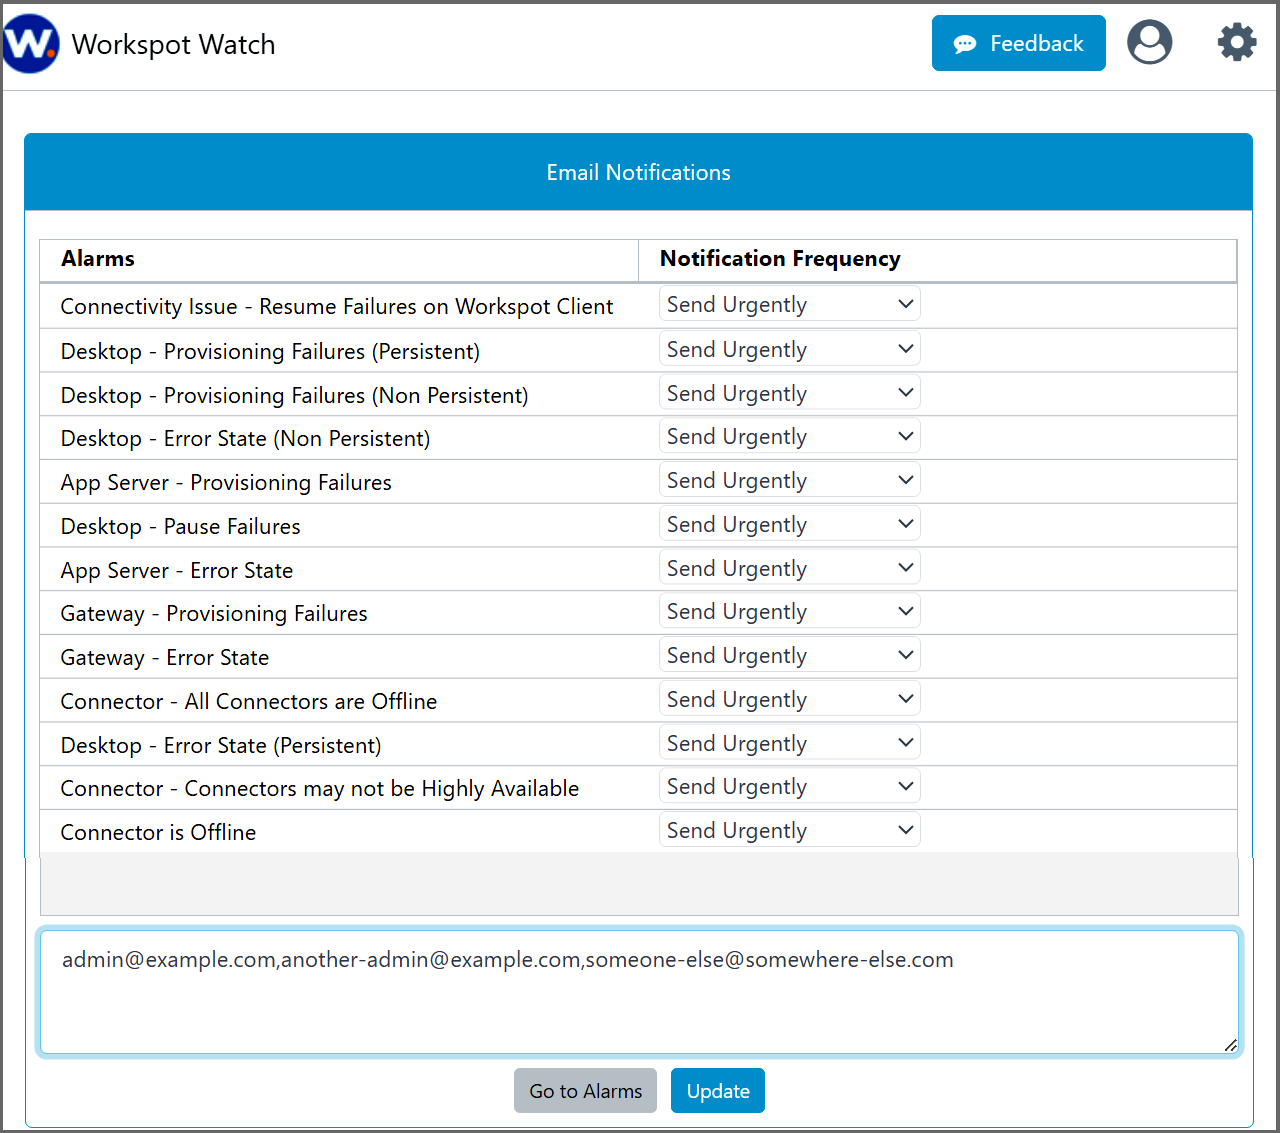
Email notifications are set by navigating to the “Settings > Manage > Email Notifications.” This displays the list of email notifications, shown below.
Each Alarm on the list has one of three settings:
- Send Urgently (send an email at once).
- Hourly (send notifications once per hour).
- Never (do not sent notifications).
Notifications are sent to every email on the comma-separated list of email addresses in the text box at the bottom of the page. These do not have to be inside your organization.
Click “Update” to update the Alarm settings and mailing list.
Emails for a given alarm are sent once: they do not repeat.
Related Documents
Administrating Workspot Watch in Control.